
Compensation for DCs is down this year, but other factors indicate chiropractic is in a positive place
WHEN 2023’S ANNUAL SURVEY WAS RELEASED, COVID-19 MOST DAYS FELT LIKE YESTERDAY’S NEWS — and while new variants continued to evolve, most health care providers, including chiropractors, had largely shaken off the effect of the pandemic. However, the healthy living kick so many Americans had embarked upon in the wake of the disaster has largely waned, our dipping dollar amounts suggest.
Information we received via our survey showed some slight downturns across the board, some downright plummets in others and just slight year-over-year variations in still others. For example, salaries and total chiropractor compensation have flattened and even dropped off for some, but increased significantly for others, notably group practices, while spending on things like office space and advertising have increased or decreased depending on the type of practice. The anomalies that showed up last year after 2021’s steady rise have persisted.
Over the last few years, the traditional gender gap of 80/20 between male and female chiropractors has narrowed, with a small dip in 2021 we attributed to women who had had to leave the workforce due to dealing with the pandemic — studies had shown women were largely in charge of educating children and other pandemic-related responsibilities. Last year the percentage of women responding to our survey rose to 27%, narrowing that roughly 80/20 gap, but that percentage of women dipped to 25% this year. When it comes to chiropractic school enrollees, an almost 50/50 split between males and females persists, but our survey never reflects this shift.
There is strength in numbers, as chiropractors have been increasingly joining forces with other health care providers to bolster patient satisfaction, manage cost savings and offer one-stop wellness service. Approximately 27% of DCs said they employ a massage therapist, followed by 9% who employ an acupuncturist and 6% who employ a nurse practitioner.
Last year we predicted our survey’s many unusual dips would be temporary, but we haven’t seen that prediction borne out; the ebbs and flows continue this year. Our 26th Annual Salary & Expense Survey suggests that chiropractic’s position in the health care market is viable and strong, but that consumers may be holding
steady or tapering off on adding to their established wellness care.

Gender and salary
From a high of 28% in 2020 and a drop this year to 25%, the percentage of female DCs in our survey remains relatively constant. Females had been largely impacted during COVID-19 shutdowns in terms of job losses or leaving employment to care for families and other duties. The huge salary discrepancy between male and female DCs continues to show up in our survey.
Male chiropractors still report more income than females — significantly more. This year, males made $160,000 while females reported $112,400. Last year, total compensation for men was about $165,000, while female chiropractors’ weighed in at only $105,000; and in 2021 those numbers were $161,500 and $80,039, respectively. So, female DCs, like female medical doctors, remain consistently behind their male counterparts in earnings, even when overall earnings rise.
The challenge of diversity in chiropractic
Starting in 2021, given increased national attention to issues of race and diversity, we added a new question: Are you a minority-owned practice or do you work for a minority-owned practice? This year we hoped our responses would reflect changes from last year’s stark divide of 13% minority-owned to 87% non-minority-owned practices. It didn’t happen. This year showed 89% non-minority-owned practices.
Where do we go from here?
Most chiropractors’ billings have decreased; however, our average respondent reported seeing 154 patients (including eight new ones) per week — an increase from last year’s average of 142. More patients but less revenue suggests patients aren’t spending as much per visit as they have in previous years, but the growing stream of patients indicates the demand for this holistic, natural care continues to grow.
The average DC profile
Our Salary & Expense Survey attracted a wide range of doctors across the nation, with responses from practitioners between the ages of 25 to more than 70 years old, and from those who have been in practice for less than a year to 30 years or more. By averaging the responses to many of this year’s questions, we can see what the average respondent might look like:
- male (25% of respondents were female)
- 49 years old
- a solo practitioner (52%)
- licensed in one state (82%)
Our average respondent:
- owns one clinic (90%)
- prefers to practice in the suburbs (56%)
- sees 154 patients a week; patient-visit average (PVA) of 60.3
- attracts eight new patients each week
- and sees patients about 31-40 hours a week (45%)
The average respondent has:
- average billings of $663,010 and collections of $489,129 for a
reimbursement rate of 74% - sells products to patients for 5% of gross revenues
- pays CAs $36,833 and himself $120,390
- and enjoys average total compensation of $148,944
Finally, this typical respondent spends roughly $30,509 per year on office leases or mortgages, $16,512 on advertising, and $3,372 on malpractice insurance.

Billings and collections
Average collections increased compared to last year’s numbers, while average billings dipped a bit.
Average gross billings were reported at $663,010, which is a slight decrease from last year’s $664,244. Collections were reported at $489,129, which is a fairly significant increase from $463,161 in 2022.

This year’s billings and collections numbers equal an average reimbursement rate of 74%, a 5% increase over 2022’s 69%. DCs appear to be billing for less overall, but receiving a higher percentage of that money back than in previous years.
How do MDs compare?
As chiropractors assess their earnings and expenses, familiarity with their financial environment in the health care industry can provide valuable context to their conclusions.
Some DCs team up with MDs to create a more comprehensive practice; others consult regularly with general practitioners in their community. As such, we annually compare our salary survey to data collected by Medical Economics.
In Medical Economics’ 93rd Physician Report, published in June 2022, respondents indicated that the average salary for a family care physician was $240,000. This is sharply contrasted with specialist physicians, who typically top out much higher, such as OB/GYNs, who make $300,000 per year on average.
Comparatively, the average total compensation reported for DCs in this year’s survey was $149,000; this is way down from $181,600 in 2022. Medical Economics also reported that the highest median income came from the South and Midwest regions ($273,000), but salaries for all regions were between $263,000-$273,000. Urban physicians earned more ($271,000) than their suburban and rural counterparts ($266,000 and $269,000, respectively).
In addition, Medical Economics found that median earnings remained significantly higher for men than women, with a $70,000 gap in pay for the past two years, compared to a gap of $74,000 that persisted for the prior two years’ surveys. They also noted that physicians in hospital- and government-owned practices earned
more than those in private practice.
To compare more statistics between chiropractors and medical doctors, visit Medical Economics at medicaleconomics.com.
How patients pay for treatment
While a DC’s true specialty lies in the ability to provide successful chiropractic care, you likely have several other income sources, such as retail, diagnostics or consulting.
DCs still report that their major source of income comes from patient chiropractic care, highlighting the dedication and commitment DCs have to their patients. About 79.5% reported patient treatment as their major source of income, which is less than in 2022.
Other sources of income include diagnostic testing at 7%; selling retail products at 5%; and consulting within the industry at 2%.
We also asked what percent of treatment is paid for by: cash from patients, individual or group health insurance, Medicare, Medicaid, personal injury coverage, Workers’ Compensation, barter or trade, and other.
The majority of treatments are paid in cash (36.5%) or by individual or group health insurance (27.5%). Personal injury coverage paid 12.5%; Medicare paid 9.5%; Medicaid paid 5%; Workers’ Compensation paid 3%; and barter/trade
paid for 1% of treatments.

Solo DCs vs. group practices
This year’s survey showed a slight increase in the number of DCs practicing in groups (or partnerships) at 26%; this represents a 3% rise from last year’s 23%. However, since 2013, the number has hovered between 22-30%, showing that a fair number of DCs have found success in joining forces.

The 52% of doctors reporting as solo practitioners fell from last year’s 56%. Those indicating they were working as an associate increased a little this year to 17%, as did the number of franchisees or those working in a franchise at 2.6%. This year we also asked about independent contractors (3%).
When it comes to billings and collections, solo practices saw significant decreases in both amounts this year. Solo DCs reported average billings of $399,223 and collections of $280,218, compared to average billings of $429,800 and collections of $313,700 last year.
The solo reimbursement rate was down three percentage points (70% compared to 73% last year). Group practice billings and collections fared better over solo DCs across the board, in keeping with the established trend, but reimbursement rates remained constant. This year’s group billings were $1,185,219 (compared to $1,069,270 last year) and collections came in at $885,766 compared to $797,348 in 2022. The group practice reimbursement rate tied with last year’s 75%.
The average total compensation for solo DCs this year was $137,372 compared to $166,800 last year. The average total compensation for a DC practicing in a group setting dropped from $218,400 last year to $195,777 this year. Salaries for solo DCs
averaged $93,583, a smallish dip from $94,500 last year, and those participating in a group practice averaged $120,365, down quite a bit from $139,300 in 2022.
Note: Total compensation for unincorporated DCs is defined as earnings after tax-deductible expenses, but before income tax. For DCs in a professional corporation, it is the sum of salary, bonuses and retirement/profit-sharing contributions made on their behalf.
Solo practices spent $2,223 on insurance (down a little from last year’s $2,400), and $7,965.68 on advertising. Group practices spent more on insurance than last year ($4,985 compared to $3,800 in 2022). They also spent $32,041 on advertising, a sizable increase compared to the $21,225 they spent in 2022.
Group practices are spending less this year on office space, though, at $45,825 compared to $50,000 last year. Solo practices spent much less on office space this year at $19,392 compared with last year’s $33,700.

Integrative care still evolving
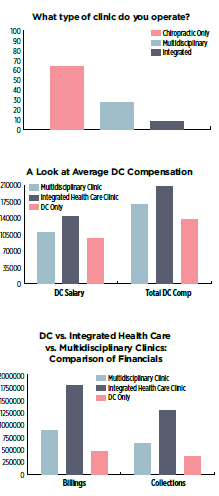
In response to reader requests years ago, Chiropractic Economics expanded its“integrated clinics/DCs only” breakdown to provide a more comprehensive look at the profession. We continued that trend this year by asking respondents to indicate if they were practicing as a DC only, in an integrated clinic or in a multidisciplinary clinic. An integrated clinic includes both a DC and a medical doctor on staff. A multidisciplinary clinic is defined as having a practicing DC and any other complementary medicine practitioner on staff (e.g., acupuncturist, PT, LMT).
This year 64% reported offering chiropractic care only, approximately the same as last year; 28% said they operated as a multidisciplinary clinic, significantly less than last year; and 8.5% responded as an integrated clinic, a way smaller number than last year’s 30%.

Here is a breakdown of income by clinic type:
Billings — Integrated practices reported the highest billings ($1,808,333), while multidisciplinary practices reported billings of $896,050 and DC-only practices came in at $467,953.
Collections — Likewise, integrated practices saw the highest collections ($1,296,833) while multidisciplinary clinics reported collections of $621,547, and DC-only practices had collections of $363,722.
Salaries and total compensation — Multidisciplinary, integrated and DC-only clinics saw a range of salaries. Integrated DCs had an average salary of $143,444 annually, compared to $108,500 in 2022. Multidisciplinary clinics had an average of $109,500, and DC-only clinics had the lowest salary at $97,046. This is especially interesting because DCs in DC-only clinics made the highest salary of the three types last year.
Total compensation for unincorporated DCs is defined as earnings after tax-deductible expenses, but before income taxes. For DCs in a professional
corporation, it is the sum of salary, bonuses and retirement/profit-sharing
contributions made on their behalf.
Regarding total compensation, integrated DCs pulled in $207,071; multidisciplinary clinics made $168,224; and DC-only clinics made $137,646.
The gender gap
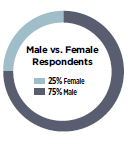
Our survey consistently illustrates an approximate 80/20 male-to-female split that makes up the chiropractic industry, and this ratio has been slowly changing for the past few years. This year saw a small decrease, but still closing in on the ratio at chiropractic schools, closer to 50/50. We’ve seen a slow but steady increase in female respondents over the last few surveys, except for a dip in 2021 and this year, when 25% were female as compared to 27% in 2022, 25% in 2021, 28% in 2020 and 23.3% in 2019.
These results allude to an overall positive trend regarding closing the gender gap. Whether salaries are up or down, however, male DCs always make more. This year’s female DCs reported an average salary of $85,154 compared to $87,500 last year. Total compensation is $112,425 compared to $104,900 last year. Males saw a decrease in salary: $109,991, a sharp fall from $141,000. Total compensation for men showed a smaller drop, $159,710 versus $165,000 last year.
Only 18% of female DCs worked 31-40 hours in patient care per week; 16% reported 21-30 hours. Of males, 72% reported working 31-40 hours, with 49% working 21-30 hours.


DCs by U.S. region
Most DCs’ compensation increased and decreased compared to 2022’s numbers. Reported regional DC total compensations (rounded) for 2023 were:
Midwest — $121,500 vs. $121,300 in 2022
West — $161,900 vs. $191,600 in 2022
East — $140,100 vs. $134,000 in 2022
South — $194,500 vs. $152,300 in 2022
The Midwest once again saw the largest reimbursement rate this year with an average of 83%, and the West followed closely behind at a rate of 82%. The South and East saw reimbursement rates of 65% and 60%, respectively.
Aging gracefully

As you grow older, your salary as a DC should increase also. The results of this year’s survey showed that experience and age still reign — mostly — when it comes to earning larger
paychecks.
DCs aged 56-65 earned the most with $197,370,
with those 46-55 earning $163,385, those 36-45 earning $155,000, and the rest pulling in around $100,000. The youngest and oldest groups of DCs, those 26-35 and 66-75, earned the least money.


Location matters
With more available retail space, a developing infrastructure and a large range of potential patients, it shouldn’t be a surprise that many DCs choose to set up their practice in the suburbs.
Over the course of many surveys, the majority have responded that the suburbs are the ideal location for their practice. This year was no different, with 56% of DCs reporting the suburbs as their location preference.
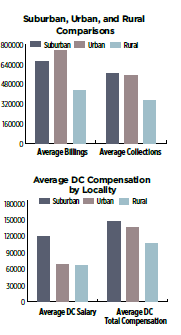
Although the numbers were similar to last year’s, there was a very slight dip in suburban DCs at 56% compared to 57% last year. The number of urban practices dipped slightly from 29% last year to 26% this year. The number of rural practices grew a bit to 18% from 2022’s 14%.
Suburban chiropractors once again reported the highest average salary at $119,182, with their urban counterparts reporting an average of $68,740. Rural practices plummeted to an average salary of about $66,000, versus $94,000 last year.
Suburban practices had average billings of $666,440 and collections of $564,860 for a reimbursement rate of 85%. Rural practices reported a reimbursement rate of 81%, with $426,956 for billings and $344,375 for collections. Urban DCs had average billings of $755,296 and collections of $548,182 for a reimbursement rate of 73%.
Who’s working for you?
We asked respondents for anonymous salary information on full-time employees only — not part-timers. We defined “full time” as employees who work 30 hours or more a week.
Approximately 18% of DCs in our survey do not have any employees, while approximately 45% employ one to three full-time people, and 28% of respondents reported they employ five or more people.
The average salary paid to full-time employees was: DC: $120,390; associate: $77,209; PT: $17,200; CA: $36,833; and LMT: $20,613.
Business expenses
For more DCs, operating as a businessperson is invariably a huge part of being a doctor of chiropractic. And as the business world continues to change and evolve, generally, so do the expenses involved in running a practice.
We’ve highlighted three standard spending areas in the profession: malpractice insurance, advertising, and an office lease or mortgage.
Office lease or mortgage — Average yearly costs were $30,509, a decrease from $33,700 last year.
Advertising — Average costs in this year’s survey were $16,512, a big jump from last year’s $11,800.
Malpractice insurance — Respondents reported an average expense of $3,372, much more than last year’s $2,400.
2 recent variables
While coverage of the COVID-19 pandemic has largely waned, our national discussion over the last three years has repeatedly returned to the state of racial relations in the U.S. To incorporate this timely information into our survey we added new questions pertaining to these topics starting in 2021.
In 2021, most DCs reported some pandemic-related income loss, though 24% said they lost no income; then in 2022 income increased almost universally, suggesting
the profit-dampening effects of the coronavirus had been shaken off. However, this year salaries, compensation and billing have dipped again.

When asked what percent of their patients were Black, Hispanic or of color, the DCs in our survey reported that approximately 8% of patients seen in suburban clinics are minorities, followed by 3% in urban practices and 0% in rural practices. While this data suggests minorities are embracing chiropractic, it’s a slow adoption. The number of DCs of color lags behind as well, as our survey showed only 11% of practices are minority-owned, a slight decrease from last year’s 13%.
Product offerings
Our survey shows approximately 78% of chiropractors in our survey sell at least
one product in their practice. As this number has consistently remained high over
the years, it’s clear that DCs across the board find success through the integration
of quality care and providing patients with the best products available.
A commitment to retailing top-industry products benefits the DC financially, but doing so also creates an important relationship between patients and the products they need to achieve wellness.
So which products do respondents offer? Are you selling the same products as
other DCs? The top five include:
1. Nutritional products/supplements — 49%
2. Hot/cold compresses — 47%
3. Educational material — 39% 4. Pillows — 38%
5. Orthotics — 37%
Of chiropractors surveyed, 16% sell cannabidiol (CBD) topical products to patients, while 10.5% sell edible products containing CBD; these topicals and supplements are made from the non-psychoactive component of the cannabis plant.

About this survey
Our 26th Salary & Expense Survey had 354 participants responding to an anonymous, confidential web-basedquestionnaire. During March and April 2023, Chiropractic Economics magazine invited practicing chiropractors (and CAs on their behalf) to complete the yearly survey.
We extended the invitation by email as well as through announcements in our e-newsletters and social networking sites. Additionally, we encouraged a number of state, national and alumni associations to distribute the survey to their members.

Regional representation — Our response to this year’s survey was wide-ranging, with participants from 39 states. The regional breakdown is as follows: Midwest, 44.1%; South, 26.5%; West, 19.3%; and East, 10.1%.
Statistics — You will find references to averages (or means) in this year’s survey. Reader feedback has indicated that the survey is better understood by only stating averages. The average is the number calculated by dividing the total by the number in the set — an arithmetic average.
ALLISON M. PAYNE is a writer, editor and proofreader based in Northeast Florida. She can be reached at allisonmpaynewriter.com.
Related Posts
 The 2022 Chiropractic Economics Annual Fees & Reimbursements Survey
- A Continued Rebound: The 24th annual Chiropractic Economics Fees & Reimbursements Survey
- Chiropractic Economics 2020 Fees and Reimbursements Survey Results
- The 21st Annual Fees and Reimbursements Survey
- 19th Annual Chiropractic Fees and Reimbursements Survey


