Our chiropractic survey data shows a leveling off in the industry, and looming changes stand to impact future reimbursements.
But reforms that favor effective care play to the profession’s goals and strengths.
It may feel at times like the healthcare market is working against you with its continual turns and changes.
But as the expectations for healthcare continue to switch from quantity to quality, doctors of chiropractic are in a perfect position to shine.
Quality care is something chiropractic has valued since its inception, and in response to the oncoming changes in healthcare frameworks DCs can offer unique value to patients and capitalize in more ways than before.
You may also feel that your reimbursements are continuously being reduced and that the industry is in a downturn. While the chiropractic profession is still recovering from the 2008 recession, reimbursements are now remaining steady after years of decline.
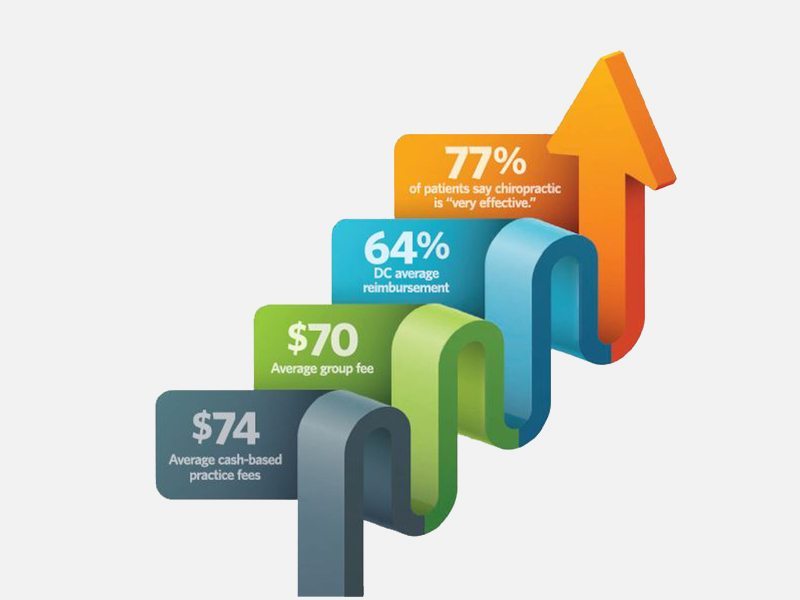
The results from our 2016 survey support a trend toward stabilization, as we saw average reimbursement rates holding at 64 percent. In addition, fee and reimbursement values ($68 and $44, respectively) indicated slight improvements. These numbers reflect data recorded after the transition to ICD-10 coding.
Then there’s the public’s perception of chiropractic, a subject on which Palmer College of Chiropractic in conjunction with Gallup shed further light with its second national survey.1 Released in September, the survey results showed that 15 percent of U.S. adults saw a chiropractor in the last year and of those, 77 percent described chiropractic care as “very effective.” This is an increase from the previous study in 2015, which found that 14 percent of the survey respondents reported using chiropractic care within the past 12 months. It also showed that a majority of those surveyed believe DCs are effective at treating neck and back pain, a trend that may continue to increase as people seek alternatives to opioids for pain management.
Finally, the shift toward value-based reimbursements will soon be the new normal when working with Medicare patients and those payers that follow suit. That means the fee-for-service model you see displayed across the following pages may look different next year and in the years to come as we record and relate those changes.
Fundamentally, the goal of a value- based payment model is to refocus on quality, rather than patient volume and service duplication, and to lower costs.
DCs are capable of delivering on this expectation in the form of conservative, nonsurgical care that often produces positive outcomes for patients.
Time will tell if the profession can take full advantage of the demand for quality. Although change can be uncomfortable, it may actually be a blessing for those who can stake their claim in evidence-based results and proven patient outcomes with EHR software.
To be adept in this evolving realm, though, you must also be adaptable. Here are several key takeaways from this year’s Fees and Reimbursements survey:
Southern state of mind: In contrast with previous year’s results, the South has overtaken the West in 2016 for the highest reimbursement rate at 66 percent.
Better together: This year, 27 percent of survey respondents reported working in a group practice, and these doctors indicated higher fees and reimbursements ($67 and $45, respectively) than the overall average. This trend has been growing over the years and we expect the number in group practice to continue to increase. In addition, the 56 percent of doctors who reported having specialists on staff also fared better financially than those without.
Pays to be cash: In 2015, 16 percent of total respondents collected cash only for their services. That number decreased to 13 percent in this year’s survey. But for cash-based practices, their fees remained higher than the overall average, making it a viable option for those in position to make such a change.
Payment concerns: The number of DCs offering payment plans declined again, this year by 4 percent, perhaps reflecting a lower patient demand for such financial assistance. Those offering a prepayment plan also declined this year by 5 percent.
Get regional
Across the nation, the average fees and reimbursements among chiropractic practices continue to vary by region. For the second year now, those doctors reporting from the South have indicated the highest average reimbursement rates. This year, the West followed closely behind. This is a change from last year’s survey where the West had the highest reimbursements among the regions.
This year, overall fees ($68) decreased slightly, as did reimbursements ($44) for an average reimbursement rate of 64 percent, down from 66 percent in 2015.
The South reported the highest average reimbursement rate at 66 percent (up from 63 percent last year). Fees remained steady at $66 with reimbursements at $43 in this year’s survey.
The West had the highest average fees but trailed the South with an average reimbursement rate of 65 percent, down from last year’s 70 percent.
The Midwest had a reimbursement rate of 62 percent—down from the previous year—but reported higher average fees and reimbursements ($64 and $40 respectively, compared to last year’s averages of $60 and $39).
Although the East reported the lowest average reimbursement rate at 60 percent, the region’s fees and reimbursements rose from last year to $66 and $40 (compared to $58 and $37, respectively).


Holding the line
Last year we described an era of increased confidence in the chiropractic industry with an overall post-recession leveling of fees and reimbursements. That remained true among our 2016 survey participants.
Our annual survey showed a slight increase in fees from $66 in 2015 to $68 this year, and the slightest rise in reimbursements ($43 to $44). However, the overall reimbursement rates decreased slightly, from 65.6 percent last year to 63.8 percent in 2016. It should be emphasized that these percentages lie well within the margin of error in our survey and thus we interpret these numbers as being relatively unchanged.
For the last three years, reimbursement rates have held steady around 61 and 65 percent; this year’s number falls squarely between those averages. While only time will tell how major changes in healthcare will affect the industry, this year’s results show a consistency that indicates a stable chiropractic market for the time being.

Team efforts

Among our survey participants this year, 27 percent reported operating in a group setting. This is up from the 24 percent who reported in 2015 and the 22 percent in 2014. It is the highest percentage of group practice participants recorded in 18 years.
Respondents reporting as associates rose slightly from 2 to 3 percent this year. Coming in at 70 percent, DCs with solo practices made up the vast majority of our survey respondents.
On average, group practices reported higher fees, reimbursements, and reimbursement rates than solo operations in 2015. Group practices had average fees of $70 and average reimbursements of $49, while solo practices had average fees and reimbursements of $65 and $44, respectively.
Reimbursement rates in solo practices increased slightly from last year to 68 percent (compared to the previous 66 percent), while reimbursement rates in group settings rose from 2015’s survey (68 to 70 percent).
As expected, group practices reported a higher percentage of specialists working in their clinics. Fifty-two percent of solo DCs answered “none” when asked what specialists they employed, while just 27 percent of group practitioners answered the same. The most common specialist in a group practice was an LMT at 58 percent.
DCs and MDs: a growing divide
The ebb and flow of reimbursements in the chiropractic field often mirror what’s happening in the healthcare industry as a whole, but to a different or lesser extent. These parallels can be observed by evaluating the common codes shared by both MDs and DCs, specifically 99201 (evaluation and management for new patients) and its variations including 99202, 99203, and 99204.
For example, last year, the overall decline in MD reimbursements recorded by Physicians Practice, a business journal for medical doctors, was in contrast with the slight growth or leveling of these same codes for DCs. While the dollar value of MD reimbursements for these codes remained a bit higher on average than those values reported by their DC counterparts (even with declining reimbursements), the results showed a shrinking financial gap between the professions with regard to these core codes.
Strikingly, in 2015-16, DCs (per this survey) and MDs (according to the Physicians Practice survey published in February 2015) reported higher reimbursements on average for all four codes. DC fees for all four codes were higher than MDs, but MDs were reimbursed at a higher rate.
The increase in reimbursements reported by MDs was markedly steeper than the growth indicated by chiropractors. So while both industries saw improvement, the 2015–2016 results illustrate a return to a broader cleft dividing the industries, with MDs appearing to experience a recession recovery at a faster rate.

Because Physicians Practice now reports solely on reimbursements, our comparisons will be limited to DC reimbursements as well. The breakdown of specific codes in 2016 is as follows:
For code 99201, DCs averaged reimbursements of $50, while MD reimbursements were $66. This is down from $52 (DCs) and up from $53 (MDs) last year.
For code 99202, MD reimbursements were $81, up from $67 the previous year, and DCs reported an average of $64, up slightly from $60 in 2015.
For code 99203, MD reimbursements increased from $86 last year to $101 this year. DC reimbursements increased slightly from $82 last year to $86 this year.
For code 99204, MDs reported a reimbursement average of $130, a significant increase from last year’s $102. Chiropractors reported average reimbursements of $109, slightly down from $110 last year.
Specialty specifics

In May 2016, our annual Salary and Expense Survey showed that teaming up with complementary specialists clearly boosts a DC’s total compensation and salary. Those salary survey participants with specialists working in their practices reported average earnings of more than $142,200, compared to the $115,500 reported by strictly solo operations.
In addition, multidisciplinary practices participating in this survey reported higher fees and reimbursements than those without specialists. The results demonstrate the multifaceted benefits of running a practice with diverse specialties under one roof.
Specifically, practices with specialists reported average fees and reimbursements of $70 and $48, while non-specialist practices reported average fees and reimbursements of $64 and $42, respectively.
For multidisciplinary practices, licensed massage therapists (LMTs) remained the most popular practice add-on, with 45 percent having one on board. LMT was followed by acupuncturist (11 percent), fitness trainer (6 percent), MD/DO (6 percent), physical therapist (5 percent), nutritionist (4 percent), and naturopathic doctor (2 percent). The 3 percent that answered “other” specified working with such specialists as a psychologist, occupational therapist, homeopath, or yoga instructor.
The fast and the franchise

Although we saw an increase in survey participants reporting as franchisees over the past three years, in 2016 that percentage dropped to 4 percent of respondents (compared to 7 percent last year).
The financial picture for franchisees brightened slightly from last year’s survey. The average reimbursement rate grew to 79 percent from 77 percent last year. However, fees dropped from $65 in 2015 to $62 this year. Reimbursements were at $49 this year, compared to $50 last year.
More to the story
This year’s survey indicates that franchise owners are slightly younger than the overall average age (49 years old compared to 50 years old). In addition, 92 percent of respondents reporting as franchisees in 2016 were male.
The average franchise owner has been practicing for 20 years (compared to the 22 year average among all respondents), owns 1 practice, and is licensed in 1 state.
This year’s survey showed that the vast majority of franchise owners are still operating a solo practice (63 percent). But those running a group practice held steady at 38 percent in 2016.
Money in the bank
Although the percentage of survey participants reporting as cash-only practices decreased from 16 percent in 2015 to 13 percent this year, those DCs who did report operating a cash-based practice fared well in their collections.
For cash-based practices in 2016, average fees were reported at $74, a number that is $6 more than overall DC average fees. In 2014, cash fees came in at $70, then grew to $76 in 2015, so this year’s data serves as an indication that cash collections continue to be on the strong side.
By strict definition, a cash-based practice would have no reimburse- ments. So, fees in a cash-only practice are equivalent to reimbursements (collections). Cash-only practice fees of
$74 are 59 percent greater than the overall average reimbursement of $44.
This year, we also asked what percentage of your collections is in cash to dig deeper into this statistic. Almost 45 percent answered that their practice had less than 25 percent cash income.
Twenty-seven percent had 25 to 50 percent cash collections, and 15 percent had 50 to 75 percent cash collections.
Your typical cash-only practice respondent is male (71 percent), with women accounting for 29 percent of cash-based practices. Survey participants in this category had an average age of 49, and typically work in a solo clinic (82 percent). These respondents have been working as practitioners for 19 years on average.
Regarding cash-only practice offerings:
- Nutrition (71 percent)
- Instrument adjusting (60 percent)
- Ultrasound (43 percent)
- Exercise programs (41 percent)
- Kinesio taping (35 percent)
- Massage therapy (35 percent)
- IASTM (33 percent)
- Electrotherapy (31 percent)
- Laser therapy (28 percent)
- Acupuncture (22 percent)
- Homeopathy (21 percent)
- Physical therapy (21 percent)
XY vs. XX
Over the past few years, the number of female survey respondents has hovered around one-quarter of all participants. In 2012, we saw an all-time high of 28 percent female respondents, and this year, 26 percent of our respondents were female.
Female chiropractors reported slightly lower average fees than male DCs ($62 compared to $67), with slightly lower reimbursement averages ($40 to $46). Female practitioners also reported somewhat lower reimburse- ment rates than male DCs (65 percent to almost 69 percent, respectively).
The 69 percent reimbursement rate for men is up from 67 percent last year, whereas reimbursement rates for women remained in line with averages from 2015.
Women respondents’ average age was 49, compared to 51 for men. In addition, female DCs reported being in practice for an average of 18 years, whereas their male counterparts have been in practice for an average of 23 years.
With regard to additional modalities offered, exercise programs (66 percent) and ultrasound (65 percent) were the most popular among men. A greater percentage of female practitioners reported offering instrument adjusting (67 percent) than male DCs (63 percent), making it the second-most popular modality among women.
Nutrition and ultrasound were also popular with female DCs.

Payment preferences
The number of doctors offering payment plans to patients this year decreased overall (51 percent compared to 54 percent in 2015). The 2016 results appear to be in line with the steady decline in payment plan offerings since 2010 and 2011, when nearly 70 percent of DCs had such plans. This is likely due to a shift toward compliant DMPOs.
The most significant change this year was reported by those DCs offering prepayment plans. In 2015, 30 percent of DCs said they offered prepayment plans compared to 35 percent in 2014. Continuing this trend, around 25 percent of this year’s respondents reported offering prepay options.
And while discounts for cash saw a decline from nearly 40 percent of DCs offering it in 2013 to only 29 percent in 2015, that number appears to be growing at around 35 percent in 2016.
The remaining responses were “negotiate per case” (28 percent), “down payment” (12 percent), “patient financing” (17 percent), and “other” (12 percent).

Keeping up with the codes
Year to year, we ask doctors of chiropractic to report on three additional codes: 95851, range-of-motion testing; 95831, muscle testing; and 97750, physical-performance evaluation. It should be noted that we did include these codes when calculating the fees and reimbursement averages for the other sections, not including the regional comparison chart.
Average fees for range-of-motion testing were $60, while average reimbursements were $29—a reimbursement rate of 48 percent.
Average fees for muscle testing were $61, with an average reimbursement of $31—a reimbursement rate of 51 percent.
Average fees for physical-performance evaluation were
$62, with an average reimbursement of $37, for a reimbursement rate of 60 percent.
Click to Download a PDF of this survey
Casey Nighbor is the associate editor of Chiropractic Economics. She can be reached at cnighbor@chiroeco.com, 904-395-3389, or through ChiroEco.com.
References
1 English, C. (2016). 2016 Gallup-Palmer College of Chiropractic Annual Report: Americans’ Perceptions of Chiropractic. Gallup. http://www.palmer.edu/gallup-report. Published Sept. 2016. Accessed Sept. 2016.
